You publish the blog posts. You update the service pages. The articles look good, and the team is proud of them. But a quiet question keeps coming back: is any of this actually working?
Publishing SEO content is the easy part. Proving that it earns its keep is harder, mostly because there are so many numbers to look at and no obvious place to begin. The good news is that you do not need a dozen tools or a data science degree. You need a clear goal, three layers of metrics, two free Google tools and about thirty minutes a month.
Here is what this guide covers:
- Start with a goal, not a metric.
- Check three layers: visibility, engagement and outcomes.
- Link Google Search Console and Google Analytics 4 (GA4) so the data tells one story.
- Review monthly, judge content in groups and act on the patterns you find.
Start with what your content is meant to achieve
Before you open a single report, decide what each piece of content is for. It is surprisingly common to publish for months without writing this down and then struggle to say whether the results are good or bad.
Pick one main job for each page or group of pages. For a UK service business, that might be more enquiry form submissions. For an online shop it might be purchases. For a consultancy it might be newsletter sign-ups or booked calls. For a thought-leadership article, it might simply be discovery by people who have never heard of you.
Then put numbers on it. Write down where you are today (your baseline) and where you want to be by a certain date. These are examples only, so swap in your own figures:
- Grow organic sessions from 2,000 to 3,000 a month within six months.
- Lift the share of organic visits that become enquiries from 1.5% to 2.5% by the end of the next quarter.
Keep the list short. Three to five key performance indicators (KPIs) are plenty. If you track everything, you end up acting on nothing.
You will know this step is done when you can explain what your SEO content is supposed to achieve in a single sentence.
The three layers of SEO content measurement
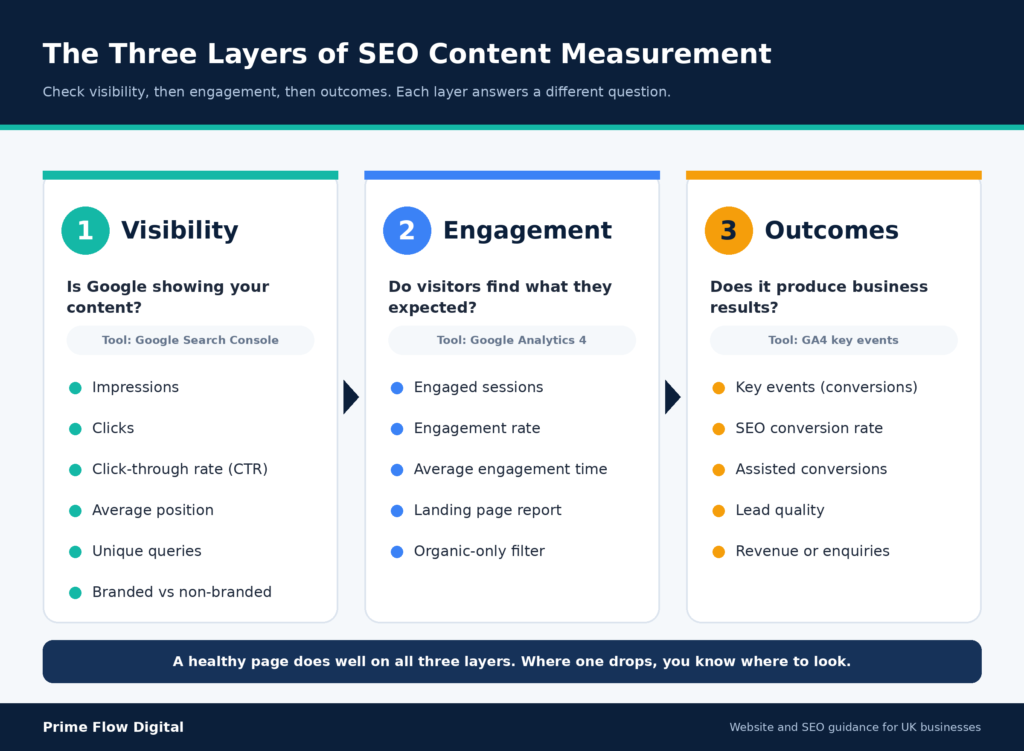
Most confusion about SEO reporting comes from mixing up different kinds of metrics. A simple way to keep things straight is to sort them into three layers that follow the visitor’s journey.
- Visibility: Is Google showing your content to people?
- Engagement: do those people find what they expected when they arrive?
- Outcomes: does the visit lead to something your business cares about?
A healthy piece of content does well on all three. A piece that does well on one layer and badly on the next tells you exactly where to look for the problem.
Layer 1: Visibility, is Google showing your content?
Visibility is everything that happens before someone clicks. Google Search Console is the place to see it, and it is free. Open the performance report, and you will find four headline numbers.
Impressions show how often your page appeared in Google results, whether or not anyone clicked. What it tells you: Google considers the page relevant enough to show. Where to find it: the top of the performance report, which you can break down by page or query. What to do next: if impressions are healthy but clicks are not, your title and meta description are probably not persuasive enough.
Clicks show how many people actually came through to your site. What it tells you: real visitors, not just exposure. What to do next: if clicks stall while impressions grow, check that your snippet accurately promises what the page delivers.
Click-through rate (CTR) is clicks divided by impressions. It is a snapshot of how compelling your listing looks. A low CTR on a page that already ranks well is one of the cheapest wins in SEO, because a better title can bring more visitors without you needing to rank any higher.
Average position shows your typical ranking for the queries that triggered your page. As a rough guide, positions 1 to 10 mean first-page visibility, 11 to 30 mean there is room to climb, and anything beyond 30 usually needs significant work. One point worth remembering: position is already an average, so do not average it again across a whole site, or you will get a number that looks precise and means very little.
Two extra checks are worth adding to your routine.
First, look at striking distance keywords. These are queries where you rank roughly between 5th and 15th place. A page there is close to the traffic but not quite getting it, so adding depth, tightening the answer and linking to it from related pages can pay off quickly.
Second, compare branded and non-branded queries. Filter for queries that include your company name, then compare them with the rest. Branded traffic comes from people who already know you. Non-branded traffic is a new discovery, and for most businesses that is the number worth growing.
If you want a more advanced signal, count the unique queries each page ranks for. A page ranking for hundreds of different queries is telling you there is demand around the topic, which is a good prompt to write supporting pages.
Layer 2: Engagement – do visitors find what they expected?
Once someone lands on your page, Google Analytics 4 takes over. GA4 records what visitors do on your site, and it is the right place to judge whether your content matches what people were looking for.
Start with the traffic acquisition report and filter it to organic search so you are only looking at people who found you through search. Then open the landing page and pages reports to see which pages bring organic visitors and how those visitors behave.
The numbers to focus on are engaged sessions and engagement rate, which show how many visits involved real interaction rather than a quick exit, and average engagement time. If a page ranks well and attracts clicks but engagement is poor, the content probably does not answer the question the searcher had in mind. That is an intent mismatch, and it is usually fixed by answering the query sooner, restructuring the page or rewriting the introduction.
A note on bounce rate. In GA4, bounce rate is the opposite of engagement rate, and on its own it can mislead. A page that answers a simple question perfectly may have a high bounce rate because the visitor got what they needed and left happy. Use bounce rate as a clue, never as a verdict.
Layer 3: Outcomes is the content producing business results?
Traffic is not the goal. Results are. This is the layer that lets you say, with a straight face, that your content is paying for itself.
In GA4, you tell the system which actions matter by marking them as key events (you may still see them called conversions in older guides and some reports). Typical examples are an enquiry form submission, a phone number click, a booking, a download or a purchase. Both big actions (macro conversions, like a sale or a consultation request) and smaller steps on the way (micro conversions, like a newsletter sign-up or a guide download) are worth tracking, because together they show the full journey.
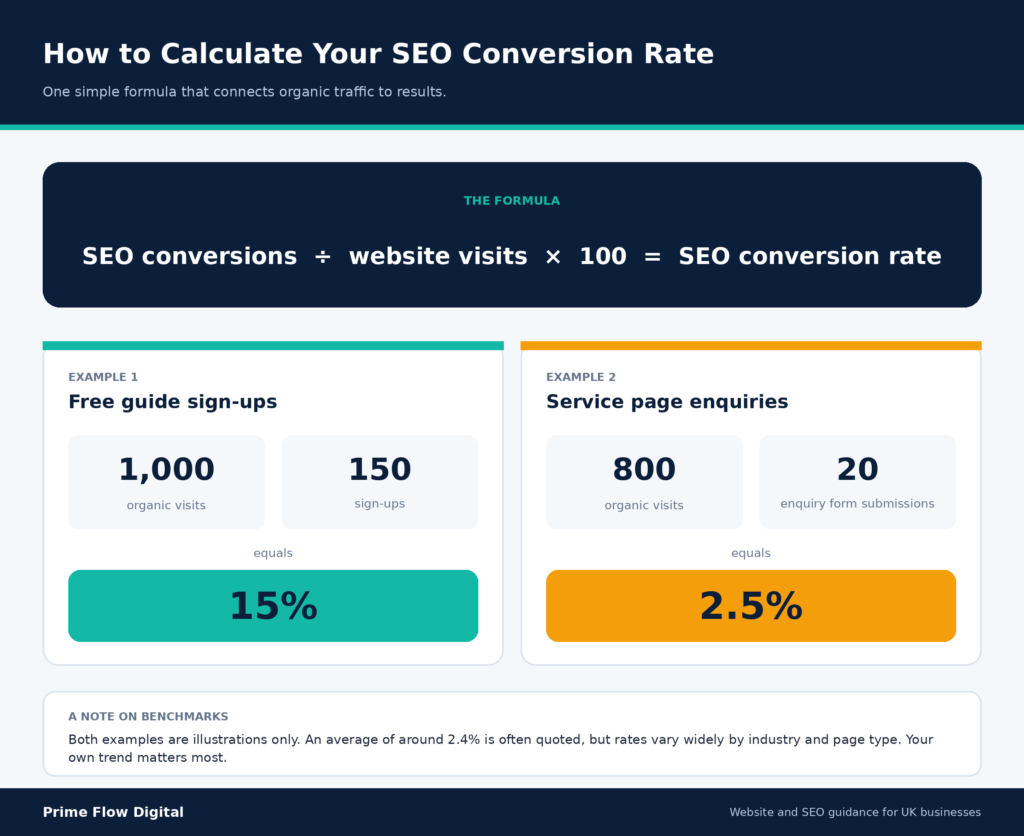
Once key events are set up, you can work out your SEO conversion rate with a simple formula:
SEO conversions divided by website visits, multiplied by 100 = SEO conversion rate
Here is a worked example. Say a blog post brought 1,000 visits from Google search, and 150 of those visitors signed up for a free guide. That is 150 divided by 1,000, which is 15%. For a more typical service business scenario, imagine 800 organic visits to a service page and 20 enquiry form submissions. That is a 2.5% conversion rate. Both figures are examples, so use your own.
You will often see an industry average of around 2.4% quoted for SEO conversion rates. Treat that as a loose reference point rather than a target, because rates vary enormously by industry and page type. Your own trend over time matters far more than any average.
Two more outcome ideas are worth knowing about.
The first is lead quality. A flood of unqualified enquiries is not a win. If your content attracts the wrong people, the numbers will look good while sales stay flat. Ask your sales or customer team whether the leads from organic search are the kind of customers you actually want.
The second is assisted conversions. Organic search often starts a relationship that another channel finishes. Someone might find you through a blog post, leave, or come back later by typing your address directly and then enquiring. If you only credit the final click, SEO looks less valuable than it is. GA4’s conversion path reports show you the typical journeys, so you can see where organic search is doing the early work.
Set up your tracking in four steps
You can set up everything above in an afternoon. It is the foundation for every report you will run afterwards, so it is worth doing properly.
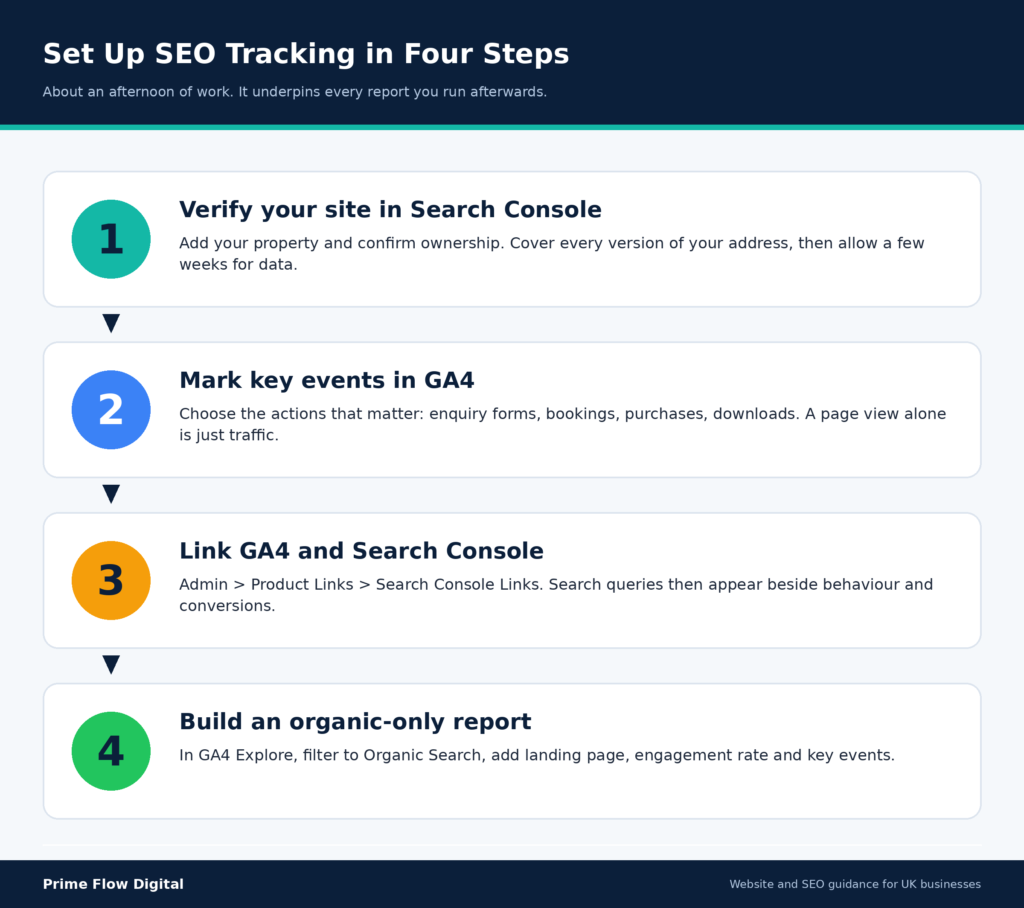
- Verify your site in Google Search Console. Add your property and confirm ownership. If your site is available on more than one version of the address (with and without www, for example), make sure each one is covered. Give it a few weeks to collect meaningful data.
- Mark your important actions as key events in GA4. Choose the specific actions that matter to your business, such as form submissions, purchases or bookings. A page view on its own is traffic, not a result.
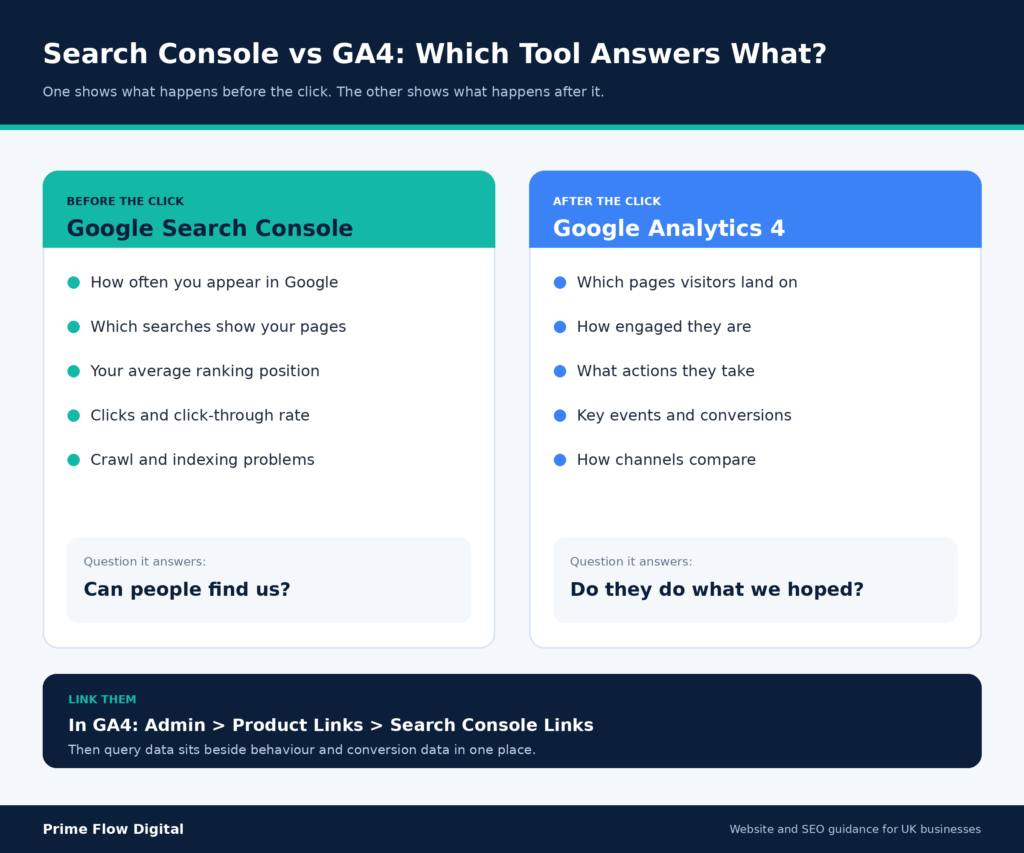
- Link GA4 and Search Console. In GA4, go to Admin, then Product Links, then Search Console Links. Once linked, search query data appears inside GA4 next to behaviour and conversion data, so you can see which queries bring visitors who actually take action.
- Build one organic-only report. In GA4’s Explore section, create a report filtered to Organic Search with the landing page as the dimension, and add engagement rate and key events as metrics. This becomes the view you open every month.
You will know it is working when you can filter GA4 to organic search and see which landing pages produce enquiries, and when Search Console shows several weeks of query history.
It also helps to understand why you need both tools. Search Console is about what happens before the click: how often you appear, for which searches and where you rank. GA4 is about what happens after the click: what visitors do and whether they take the actions you care about. Each one answers questions the other cannot, and together they give you the full picture.
It is tempting to check every article on its own and declare a winner and a loser. For SEO, that is often too narrow. A single post rarely tells the whole story, because content works as a network. One article can attract links, another can bring in first-time visitors, and a third can close the enquiry.
A more useful approach is to group your content by topic and judge each group as a whole. For example, put every article about website performance together and every article about redesign planning together. Then ask four questions about each group:
- Which topics bring the most traffic?
- Which topics generate the most enquiries or leads?
- Which topics drive the most revenue?
- Which topics earn the most links or mentions from other websites?
This matters most for brand-building content. An article written to raise awareness may produce few direct enquiries, yet still attract links, build recognition and support the pages that do convert. Judge it on enquiries alone and it will look like a failure.
How to read the signals when the numbers disagree
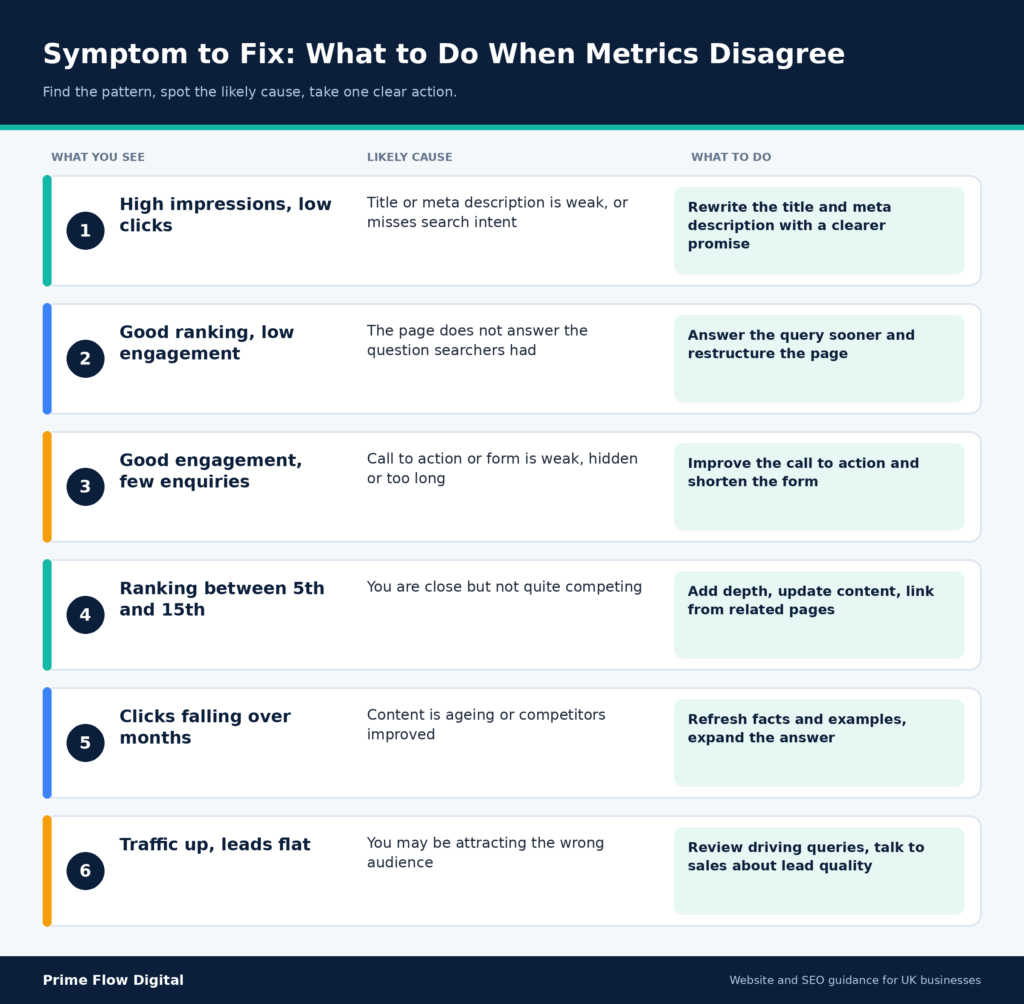
The most useful moments in reporting are when two metrics seem to contradict each other. Those moments point straight at the fix. Here are the patterns to watch for.
| What you see | Likely cause | What to do |
| High impressions, low clicks | The title or meta description is not compelling or does not match search intent. | Rewrite the title and meta description, and test a clearer promise. |
| Good ranking, low engagement | The page does not answer the question searchers had in mind. | Answer the query earlier, restructure the page, tighten the introduction. |
| Good engagement, few enquiries | The call to action or form is weak, hidden or too demanding. | Improve the call to action, shorten the form, and test the placement. |
| Ranking between 5th and 15th | You are close but not quite competing. | Add depth, update the content and link to it from related pages. |
| Clicks falling over several months | The content is ageing, or competitors have published stronger pages. | Refresh facts and examples, expand the answer, and review what now ranks |
| Traffic up, leads flat. | You may be attracting the wrong audience | Review the queries driving visits and talk to your sales team about lead quality. |
A quick word on page speed and technical health, because they sit underneath all three layers. A slow or awkward page can cost you rankings and conversions at the same time. Check Google’s Core Web Vitals for your important pages, which measure how quickly the main content loads, how responsive the page feels and how stable the layout is while loading. If your best content is sitting on pages rated poor, fixing the website itself can improve results faster than writing anything new.
How long before SEO content shows results?
It depends on the topic, the competition and the site, so be wary of anyone who promises a fixed timeline. What you can do is measure in a way that avoids false alarms. Compare like with like, such as the last 28 days against the previous 28 days. Look at quarterly trends rather than week-to-week wobbles. And make a note whenever something big changes, such as a redesign, a batch of new articles or a known Google update, so you can explain a jump or a dip later.
For most businesses, a monthly review is the sweet spot. Weekly checks tend to produce noise rather than insight.
Build a one-page monthly SEO content scorecard
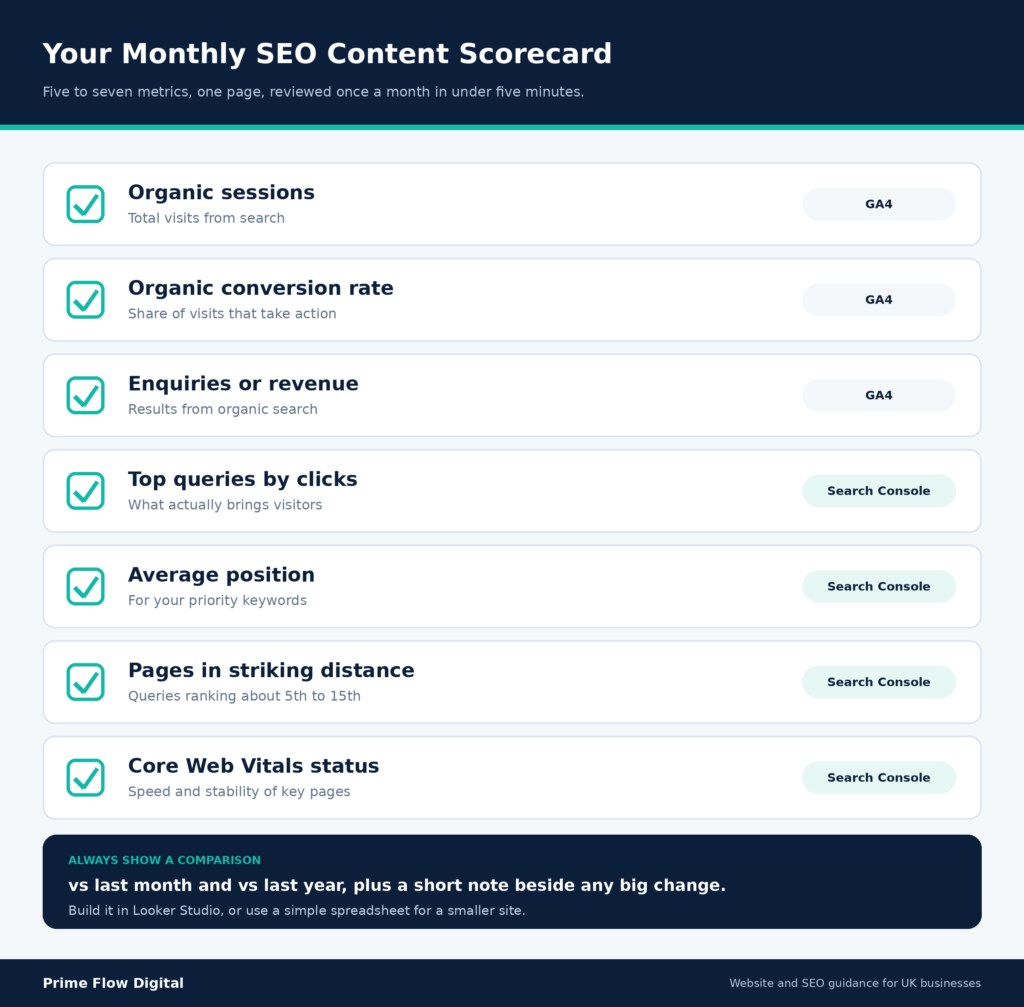
All that tracking is only useful if you actually look at it. The simplest way to make that happen is a one-page scorecard that you review at the end of each month, ideally in under five minutes.
Keep it to five to seven metrics tied to the goals you set at the start. For many UK businesses, a strong set looks like this:
- Organic sessions
- Organic conversion rate
- Enquiries or revenue from organic search
- Top queries by clicks
- Average position for your priority keywords
- Pages in striking distance
- Core Web Vitals status for key pages
Always show a comparison, because a number on its own means nothing. “2,400 organic sessions” tells you little. “2,400 organic sessions, up 12% on last month and 30% on last year” tells you the direction. Add a short note beside any big change so the reason is recorded while you still remember it.
Google’s free Looker Studio can build this automatically from your Search Console and GA4 data. For a smaller site, a simple spreadsheet is perfectly fine.
Once you have the scorecard, sort your pages into simple groups, such as strong, average, weak and priority, and attach an action to each. Weak pages might get on-page improvements. Strong pages might get more internal links to supporting content. Pages that cost a lot to produce but never perform might be refreshed, merged or retired. Reports only become useful when each finding leads to a decision.
Common measurement mistakes to avoid
- Reporting sitewide averages. An average bounce rate or total clicks figure across the whole domain hides what is happening on individual pages and topics.
- Averaging an average. The position in Search Console is already an average. Averaging it again produces a misleading figure.
- Judging by pageviews alone. The pages that attract the most visitors are not always the ones that produce enquiries.
- Ignoring conversions. Rankings and traffic are a means to an end. If you cannot connect them to results, you are only half measuring.
- Crediting only the last click. This undervalues content that starts customer journeys.
- Changing the goalposts. Switching KPIs every month makes it impossible to see progress. Pick your measures and stick with them for a meaningful period.
A note for UK businesses: consent and data gaps
If your website asks visitors to accept cookies, some of them will decline. Visitors who decline analytics cookies may not appear in GA4 at all, which means your analytics numbers can sit below your real traffic. Search Console is built on Google’s own search data rather than your site’s cookies, so it makes a useful cross-check. If Search Console shows clicks rising while GA4 sessions look flat, consent settings are one possible explanation.
This is a technical and compliance matter, so it is worth discussing how your cookie banner and analytics are configured with whoever looks after data protection for your business. This guide is general information and not legal advice.
Conclusion
Measuring SEO content does not have to be complicated. Decide what your content is for, check visibility, engagement and outcomes, connect Search Console and GA4, and review the results once a month. The point is not to collect more numbers but to make better decisions about what to write, update or retire next.
If you would like help setting up tracking, building a scorecard or making sure your website is ready to show you what is really working, get in touch with Prime Flow Digital for a free website and SEO tracking review.
How Prime Flow Digital builds measurement into your website
Measurement works best when it is planned before the website goes live, not added afterwards. At Prime Flow Digital, we build websites for UK businesses with measurement in mind from the start: clean page structures, fast-loading templates and tracking for the actions that matter, such as enquiry forms and bookings, so your first report is useful from day one.
If you would like a second pair of eyes on whether your current site and content are set up to be measured properly, we are happy to take a look.
Frequently asked questions
How do I know if my SEO content is working?
Check three things: whether Google is showing the content (impressions, clicks and position in Search Console), whether visitors engage with it (engagement rate in GA4), and whether it leads to results (key events and conversions). If all three are moving in the right direction over several months, it is working.
Can I measure SEO content without paid tools?
Yes. Google Search Console and GA4 are free and cover visibility, engagement and conversions. Paid rank trackers add convenience and competitor data, but they are not required to get started.
What is a good SEO conversion rate?
It varies widely by industry and page type. An average of around 2.4% is often quoted, but your own baseline and trend are a better guide than any general figure.
Why does my content get impressions but no clicks?
Usually the title or meta description is not persuasive, or the page does not match what searchers want. Rewrite the title and description to make a clearer promise and check the content answers the query directly.
Should I measure each blog post separately?
Look at individual posts for diagnosis, but judge success by topic group. Content supports other content, so a group view gives a fairer picture.